
Main KPIs Every Business Should Track
In today’s data-driven world, understanding and tracking the right key performance indicators (KPIs) is critical to the success of any business.

KPIs provide actionable insights that help business leaders identify strengths, address weaknesses, and stay competitive in their industry. This article highlights the most important KPIs every business—regardless of sector—should track and offers advice on how to calculate these metrics, interpret them, and present them effectively to stakeholders.
1. Financial KPIs
Why it Matters: Financial KPIs provide a snapshot of a company's fiscal health and long-term viability. These metrics are critical for identifying whether a company is growing, operating efficiently, and maintaining profitability.
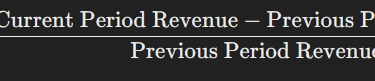
Revenue Growth: This KPI shows how much a company’s revenue is increasing over time. It helps assess market demand, the effectiveness of sales strategies, and overall business expansion.
Formula:
How to Track: Use monthly or quarterly comparisons. Tools like Excel or accounting software (e.g., QuickBooks) can automate this process. Visualize growth with trend lines to see progress over time.
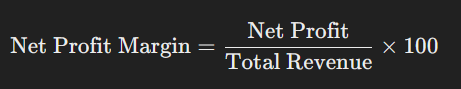
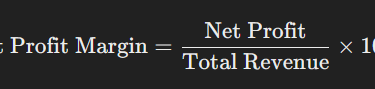
Net Profit Margin: The net profit margin measures how much profit a company makes for every dollar of revenue after all expenses are deducted.
Formula:
How to Track: Calculate using financial dashboards, and set alerts to identify any unexpected dips below your target threshold.
Cash Flow: This measures the net amount of cash moving in and out of a business. Positive cash flow ensures that a company can meet its obligations.
Formula:
How to Track: Track using a cash flow statement and forecast future inflows and outflows to ensure liquidity.
Presenting Financial KPIs:
Use comparative graphs to show revenue growth versus expenses. Avoid using pie charts if possible, prefer line graphs or others that can better provide stakeholders with an intuitive view of financial trends over time.
2. Customer KPIs
Why it Matters: Customer KPIs measure satisfaction, loyalty, and retention, critical for maintaining steady revenue and fostering growth. In most businesses, customer experience can make or break long-term success.
Customer Lifetime Value (CLV): CLV indicates how much revenue a customer will generate over their entire relationship with your business. High CLV shows that your company retains customers and maximizes value per client.
Formula:
How to Track: Use historical customer data to estimate this KPI, and monitor it through CRM tools (e.g., Salesforce).
Net Promoter Score (NPS): NPS measures customer loyalty and satisfaction by asking how likely they are to recommend your company to others. A high NPS reflects customer satisfaction, leading to more referrals.
Formula:
How to Track: Regularly survey customers and benchmark against industry standards.
Presenting Customer KPIs:
Visualize CLV using bar charts that highlight customer segments and their overall value. Present NPS as part of a customer satisfaction scorecard to correlate customer loyalty with long-term growth.
3. Operational KPIs
Why it Matters: Operational KPIs help businesses ensure smooth, efficient processes. Tracking metrics like response and resolution times allows companies to quickly identify inefficiencies, improve customer satisfaction, and minimize downtime.
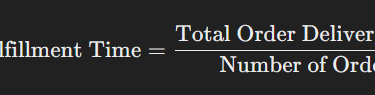
Order Fulfillment Time: This KPI measures the average time from when an order is placed to when it is delivered. Reducing fulfillment time improves customer satisfaction and operational efficiency.
Formula:
How to Track: Use automated tracking systems to monitor order fulfillment from placement to delivery.
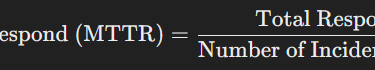
Mean Time to Respond (MTTR): This KPI measures the average time it takes for a company to respond to an incident or service request after it has been reported. A lower MTTR reflects faster response times, leading to higher customer satisfaction and smoother operations.
Formula:
Mean Time to Resolve (MTTRS): This KPI measures the average time it takes to fully resolve an issue or service request. A lower MTTRS indicates that problems are being solved efficiently, reducing downtime and minimizing the impact on the business.
Formula:
How to Track: Track resolution times using your ITSM system. Regularly review this KPI to identify patterns in incident resolution times and make adjustments to improve response processes.
Presenting Operational KPIs:
Show operational efficiencies through flowcharts or Gantt charts. Visualize order fulfillment time with process diagrams. To present MTTR and MTTRS, use line graphs that show how response and resolution times have improved over time. For stakeholders, demonstrating the decrease in these times can help justify investments in better tools or additional team training.
4. People and Culture KPIs
Why it Matters: People and culture KPIs focus on the well-being and productivity of employees, ensuring that your workforce is aligned, engaged, and motivated to contribute to the company's success.
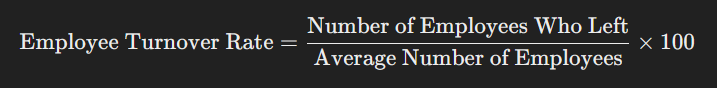
Employee Turnover Rate: High turnover can signal problems within your workplace culture, while low turnover suggests a stable and positive work environment.
Formula:
How to Track: Use HR software to monitor departures and compare them against industry benchmarks.
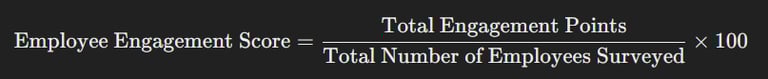
Employee Engagement: This KPI measures how motivated and satisfied employees are with their jobs. High engagement typically leads to higher productivity and lower turnover.
Formula:
How to Track: Use employee satisfaction surveys to gather data on engagement levels. Tools like Qualtrics or SurveyMonkey can help measure and analyze this information.
Presenting People KPIs:
Stakeholders appreciate seeing turnover trends through bar charts comparing turnover rates across departments. Heatmaps are also effective for visualizing employee engagement across different teams or regions.
5. Innovation and Growth KPIs
Why it Matters: Innovation KPIs track the success of new initiatives and long-term growth strategies. They provide insights into how a business is adapting and evolving in a competitive landscape.
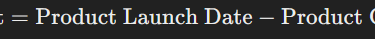
Time to Market: This KPI measures how long it takes to bring a new product from concept to launch. A shorter time to market indicates greater internal efficiency and agility.
Formula:
How to Track: Use project management tools like Monday.com or Asana to track project timelines and milestones.
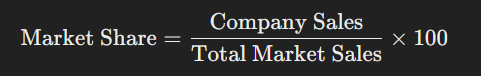
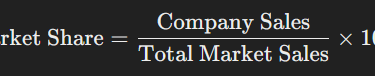
Market Share: Market share represents your company’s portion of the total market in relation to competitors. Tracking this KPI helps assess market penetration and the effectiveness of sales strategies.
Formula:
Presenting Innovation KPIs:
For innovation, present "Time to Market" using milestone charts to show progress from idea to launch. Market share is best displayed using pie charts that break down your company’s percentage of the market.
6. KPIs to Really Pay Attention To:
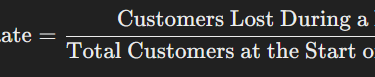
Customer Churn Rate: This measures the percentage of customers who stop doing business with you during a given period. A high churn rate can indicate dissatisfaction and needs immediate attention.
Formula:
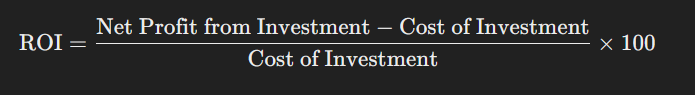
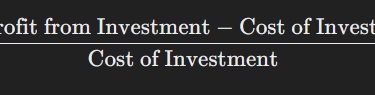
Return on Investment (ROI): ROI is critical for assessing the profitability of marketing, innovation, or any other project.
Formula:
Tracking the right KPIs is essential for any business aiming to improve performance and drive growth. By focusing on financial health, customer satisfaction, operational efficiency, people, and innovation, companies can make data-driven decisions that lead to long-term success. Presenting these KPIs clearly and effectively to stakeholders ensures transparency, supports strategic initiatives, and builds confidence in your organization’s ability to adapt and thrive.


CONTACTS
contact@acquiris.digital


ACQUIRIS DIGITAL © 2025